Pso VP 2.0This indicator provides an advanced volume analysis tool that visualizes trading activity across different price levels and automatically identifies key support and resistance zones.
How It Works:
The Volume Profile analyzes historical price and volume data within a specified lookback period, distributing volume across horizontal price levels. Unlike traditional volume indicators that show volume over time, this tool displays volume at price, revealing where the most significant trading activity has occurred.
The algorithm:
Divides the price range into customizable horizontal bars (bins)
Calculates and accumulates volume for each price level
Identifies high-volume nodes that often act as support or resistance levels
Uses percentile filtering to highlight the most significant trading areas
Key Features:
Automatic S/R Detection: Uses volume percentile filtering to identify the most significant price levels
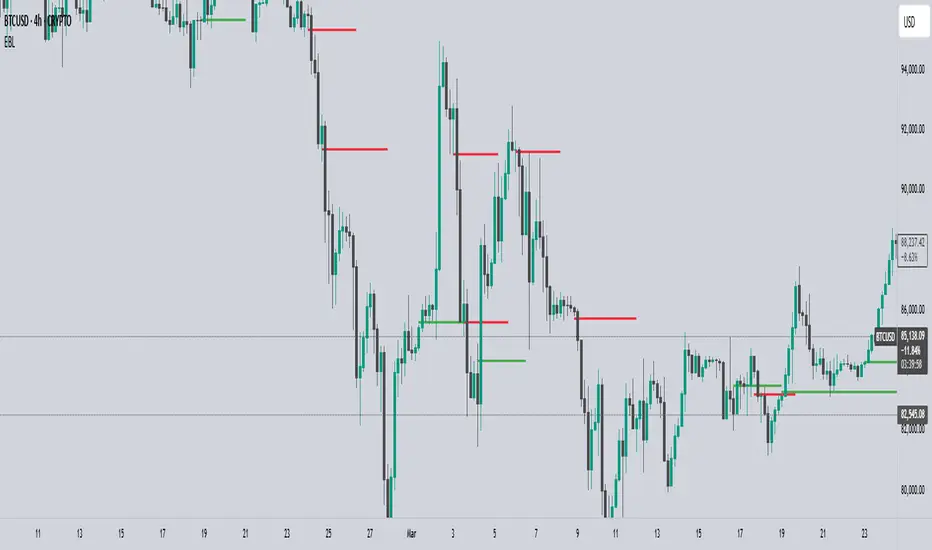
Dynamic Support/Resistance Lines: Automatically draws horizontal black lines at high-volume areas that typically act as price magnets or barriers
Customizable Parameters: Full control over lookback period, number of price bars, percentile thresholds, profile width, opacity, and line projections
Clean Aesthetic: Monochrome design for professional chart presentation
Indikator Pine Script®